Analytics
The Analytics screen rolls up where the time and the money went across your work items. This page names each panel, figure and control, and says what each number counts. Open it from Analytics in the sidebar.
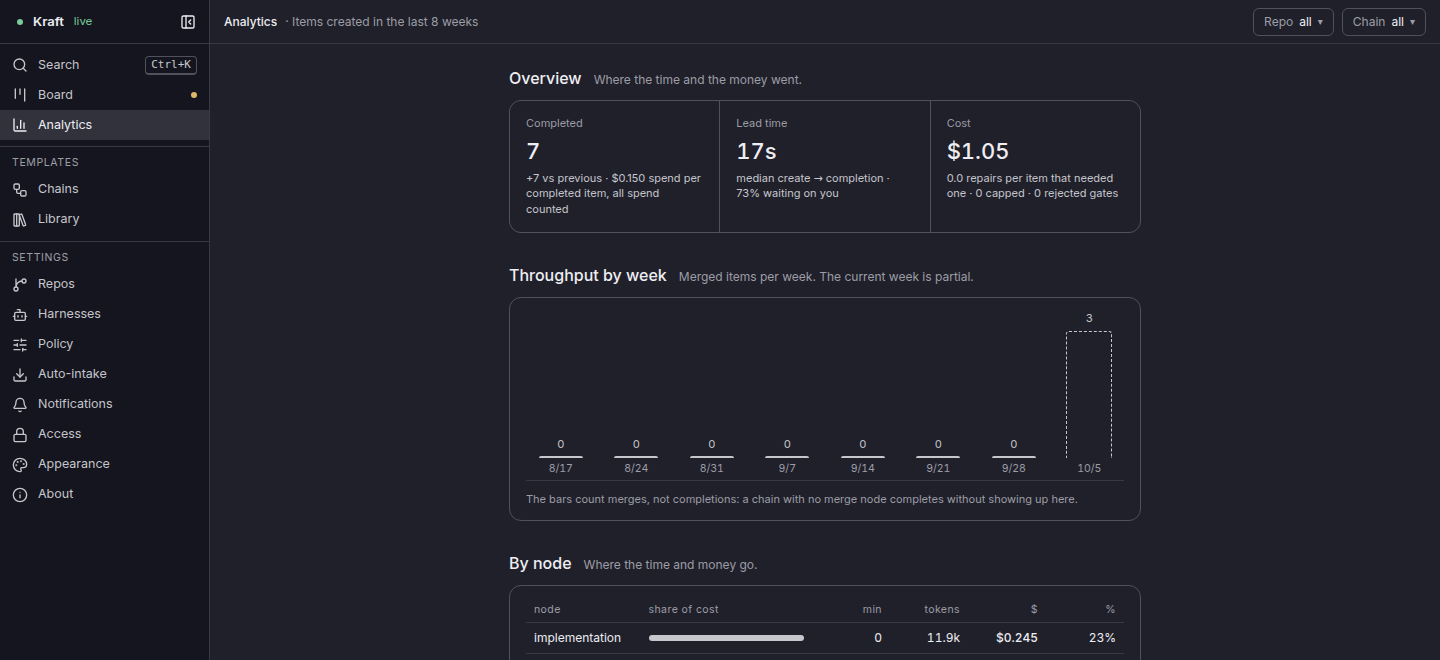
What the screen counts
- The items. Every figure covers the work items created in the last 8 weeks (56 days), narrowed by the two filters. An item created earlier is left out, even if it merged yesterday. The header reads Items created in the last 8 weeks. Only Completed, Lead time, the share waiting on you and the two figures under the stops are limited to completed items. Every other figure covers any status.
- Their history. For each of those items, the screen adds up all of its worker sessions and all of its events, whenever they happened.
- No stored totals. Kraft computes the figures from the database each time you open the screen or change a filter.
Filters
Two menus sit at the right of the header. Both default to all, and both apply to every panel.
| Menu | Choices | Narrows to |
|---|---|---|
| Repo ▾ | All repos, then each repo by its folder name, with the number of your work items beside it. | The items filed in that repo. |
| Chain ▾ | All chains, then each chain your work items use, with the number of items beside it. | The items on that chain. An item that never chose one counts as default. |
The filters reset to all when you leave the screen.
Overview
Three figures, each with a line of detail under it.
| Figure | What it counts | The line under it |
|---|---|---|
| Completed | Items whose status is completed. | +N vs previous (or -N): the change from the 8 weeks before, counted the same way. $X spend per completed item, all spend counted: Cost divided by Completed, shown when Completed is not 0. |
| Lead time | The median, over completed items, of creation to completion, so a wait after the merge, such as post_merge_ci, counts. | median create → completion. N% waiting on you: the time completed items spent stopped on you, as a share of their lead time. |
| Cost | The cost recorded for every worker session of every item in the set, completed or not. | N repairs per item that needed one, N capped and N rejected gates, explained below. |
The figures use the same units as the rest of the UI:
- A duration reads
45s,12m,2h 5mor1d 3h. - A dollar amount has three decimals under $1 (
$0.116) and two from $1 ($1.16). - A token count reads
850,17kor1.2M.
Time waiting on you runs from the moment a gate is requested, or an item stops and waits for you, until the gate is approved or rejected, the item is retried, or a node starts. It is kept apart from the item's run time, so a slow reviewer does not read as a slow agent.
Fix rounds, capped and rejected gates
- N repairs per item that needed one is the count of distinct repair rounds that ran a worker session in the items' fix-loop nodes, divided by the number of items with at least one. A repair round is round
1or higher, so an item with a first pass and one repair counts1. It covers every node that declares a fix loop, whatever its name. - A node's first pass (round
0) is no repair, and neither is the repair pass that precedes the first paid cycle. An item with no repair is left out of the division. - N capped is the number of items with a fix-loop session that ended at its attempt limit. A wait that ran out and a time cap do not count.
- N rejected gates is the number of times a gate was rejected on these items, by you or by Kraft's own review.
A trailing plus
A trailing + ($1.16+) marks a sum that is missing a session: one with tokens and no dollar figure. For example, the harness reports no cost and its model is not in Kraft's price table, or a resumed session's tokens could not be separated from the earlier session's. The true total is higher. The session's tokens still count in By node. For which harnesses report no cost, see Cost reporting.
Kraft's own estimate from the price table also goes into the sum, when the model is listed. A session still running adds a live estimate, on any harness, claude included. A finished session whose agent reported no cost adds a final one: a harness that never reports one, or a crash or interruption before the agent reported. The sum includes them unmarked, and the note under By node says so.
A running session's live estimate leaves out output tokens, so it is a floor.
Throughput by week
A bar chart of merged items per week: eight columns, oldest first. The number above a bar is its count, and a bar is as tall as its count against the tallest week. The label under it is the Monday that starts the week, as month/day, in UTC. The last bar, drawn dashed, is the current week and is partial.
A merge here is a node finishing that runs a forge task with the target mr.merge, such as the shipped merge node. A completed item whose chain has no such node, the shipped quick-task chain for one, completes without showing up. The note under the chart says so. When nothing merged, the chart is replaced with Nothing merged in this range.
By node
One row per node that ran a worker session for these items, highest cost first.
| Column | What it shows |
|---|---|
| node | The node's id in its chain. |
| share of cost | A bar: the node's cost against the costliest node, which fills the bar. |
| min | The mean wall time of one worker session on the node, over every item in range, in whole minutes. Under 30 seconds shows 0. |
| tokens | Every token its sessions used: uncached input, cache writes, cache reads and output. |
| $ | The cost of its sessions. A trailing + marks a missing session, as under Cost. |
| % | The node's $ as a share of all rows' $, rounded. 0% when the total is 0. |
The note under the table reads "Minutes are the mean wall time of one worker session, over every item in range."
With no sessions, the panel reads Nothing here yet.
By repo
One row per repo, the one with the most items first.
| Column | What it shows |
|---|---|
| repo | The repo's folder name. |
| items | Items created in the last 8 weeks, in any status. |
| done | Those items whose status is completed. |
| cost | The cost of their sessions. A trailing + marks a missing session. |
| avg repairs | The average repairs, counted as in the Overview, over the repo's items that needed at least one. It is the Overview figure for that repo alone. |
Why items stopped for a person
One bar per reason, with its count, most common first. A count is a number of stops, not of items: an item that stops three times adds three. Every item in the set counts, completed or not.
| Label | A stop where |
|---|---|
gate · <name> | A gate named <name> was requested. |
budget | A spend cap stopped the item, and the stop carries the budget's figures. |
cap breach | A fix loop reached its attempt cap, and the stop carries its cycle and attempt counts. |
orchestrator/infra defect | The reason starts resume: current-node session did not resolve cleanly. |
preventable dispatch | The reason starts needs_context: and contains blocked on, not merged or depends on, in any case. |
task failure | Any other stop that waits on you, including one no earlier label fits. |
For what each stop means and its fix, see Why did my item stop?. With no stops, the panel reads Nothing stopped for a person in this range.
Under the bars, one line holds two more figures, both over completed items only:
- N unplanned touches per item, to two decimals. It adds up the stops that nobody designed the chain to need and divides by the completed items. A
gate · ...stop never counts.budget,orchestrator/infra defectandpreventable dispatchalways count.cap breachandtask failurecount, unless Kraft cleared the stop without paging you. Two cases clear it: an automatic escalation retry, and a gate that Kraft's own review decided. - open MR → checks done X median: the median time from the node that opens the draft merge request starting to the node that waits on CI completing.
0sshows when no item has both.
A node is found by its task, never by its id: a forge task targeting mr.open_draft opens the merge request, one targeting mr.ci waits on CI. On the shipped default chain these are draft_merge_request and merge_request_feedback. The span starts when the node begins, with the rebase, and ends when CI, the automated review and any repair rounds have all passed. It covers completed items only. An item whose chain lacks either node, such as one on quick-task, adds nothing.
On a phone
On a phone, Analytics is a tab in the bottom bar and the same screen at /analytics, laid out as four tiles and three lists. See Kraft on a phone.
- Range at the top right picks 7 days (the default), 30 days or 90 days, by the same created-in-range rule. There is no Repo or Chain filter, and no weekly chart.
- Spent is Cost, with
$X spend per completed item, all spend countedunder it, the same quotient as on the desktop, and Items done is Completed, with how many items are running now. That count includes escalated items and is not limited to the range. - Time at gates is the total time stopped on you across all items in the range; under it, how much of their lead time completed items spent waiting on you. Fix loops is repairs per item that needed one, with how many items hit their cap.
- By node shows each node's runs and cost, By repo shows items, done and avg repairs with the cost, and Why items stopped for a person is the same list as above, with the same line under it for unplanned touches and open MR → checks done.
When nothing has completed in the range and no node ran, the lists give way to Nothing has completed in this range yet.
The numbers behind it
The screen reads GET /api/analytics with range, repo and template (the chain). range is 7d, 30d, 90d, 8w or all, and 7d when omitted; any other value is refused with a 400. The desktop screen always asks for 8w. The phone asks for 7d, 30d or 90d.
Related
- The board: the screen that groups the same work items by what they need from you.
- Cost reporting: which harnesses report no cost, how Kraft estimates one, and what a dollar cap does about it.
- Caps and budgets: how a spend cap and a fix loop's attempt cap stop an item.
- Why did my item stop?: the fix for each stop the last table counts.